


A Brief Guide to Using Pandas AI for Data Analysis
Learn how to set up and use Pandas AI, advance Pandas library integrated with LLM capabilities, in your data science journey, from data exploration to visualization

Beginner or experienced, all data science professionals are familiar with Pandas. It is one of the most popular and widely used data science libraries for data manipulation. For those who are aspiring to get into a data science career and don't know what Pandas is, it is an open-source Python library or package designed specifically to perform data analysis and manipulation by eliminating the need to write code from scratch.
So, when starting a data science journey in Python, it is obvious that you will come across Pandas and will be using it for most of your tasks. But what is Pandas AI?
Well, today we live in the AI era and everything is getting smarter, so are data science tools and Pandas, of course. Ever since the launch of ChatGPT by OpenAI, we can find generative AI everywhere.
They can write content, generate marketing materials, write code, and, surprisingly, perform data analysis and data visualization as well.
This is what Pandas AI helps with: doing data analysis for you without much technical effort and knowledge. By using simple prompts, you can perform data analysis and manipulation on your dataset without having to send data anywhere.
This article will help you understand how you can use Pandas AI throughout your data science journey and perform different tasks effortlessly. So, let's get started.
Setting up Pandas AI
Pandas AI is a Python library that integrates Large Language Model (LLM) capabilities directly into the Pandas API. You can use the familiar Pandas library with enhanced functions by Generative AI and make your data analysis work more intuitively with a conversational experience.
One of the key advantages of Pandas AI is its simplicity. This means you can analyze even complex datasets with simple natural language prompts without writing difficult code.
Here's how to set up:
First, install the package using pip:
pip install pandasai
Configure the LLM
Pandas AI supports different LLMs like GPT and HuggingFace models. To start with, let us use OpenAI GPT. So, you will need a OpenAI API key for that. You can get one for yourself from OpenAI website.
Use the code below to set up Pandas AI LLM
from pandasai.llm import OpenAIllm = OpenAI(api_token="Your OpenAI API Key")
Now, you are ready to use Pandas AI for data analysis and data visualization.
Data Exploration with Pandas AI
Let's start with the Titanic data from the Seaborn package as the sample dataset to explore it using PandasAI in this example.
import seaborn as snsfrom pandasai import SmartDataframedata = sns.load_dataset('titanic')df = SmartDataframe(data, config = {'llm': llm})
It needs to be passed into the Pandas AI Smart Data Frame object. This will enable conversational activity on our DataFrame.
Start with a simple question:
response = df.chat("""Return the survived class in percentage""")response
With Pandas AI, you can simply provide a prompt, and it will generate a solution or answer your query. The responses are returned as DataFrame objects, making it easy to integrate with your existing Pandas workflow.
Here are some example prompts to analyze your dataset:
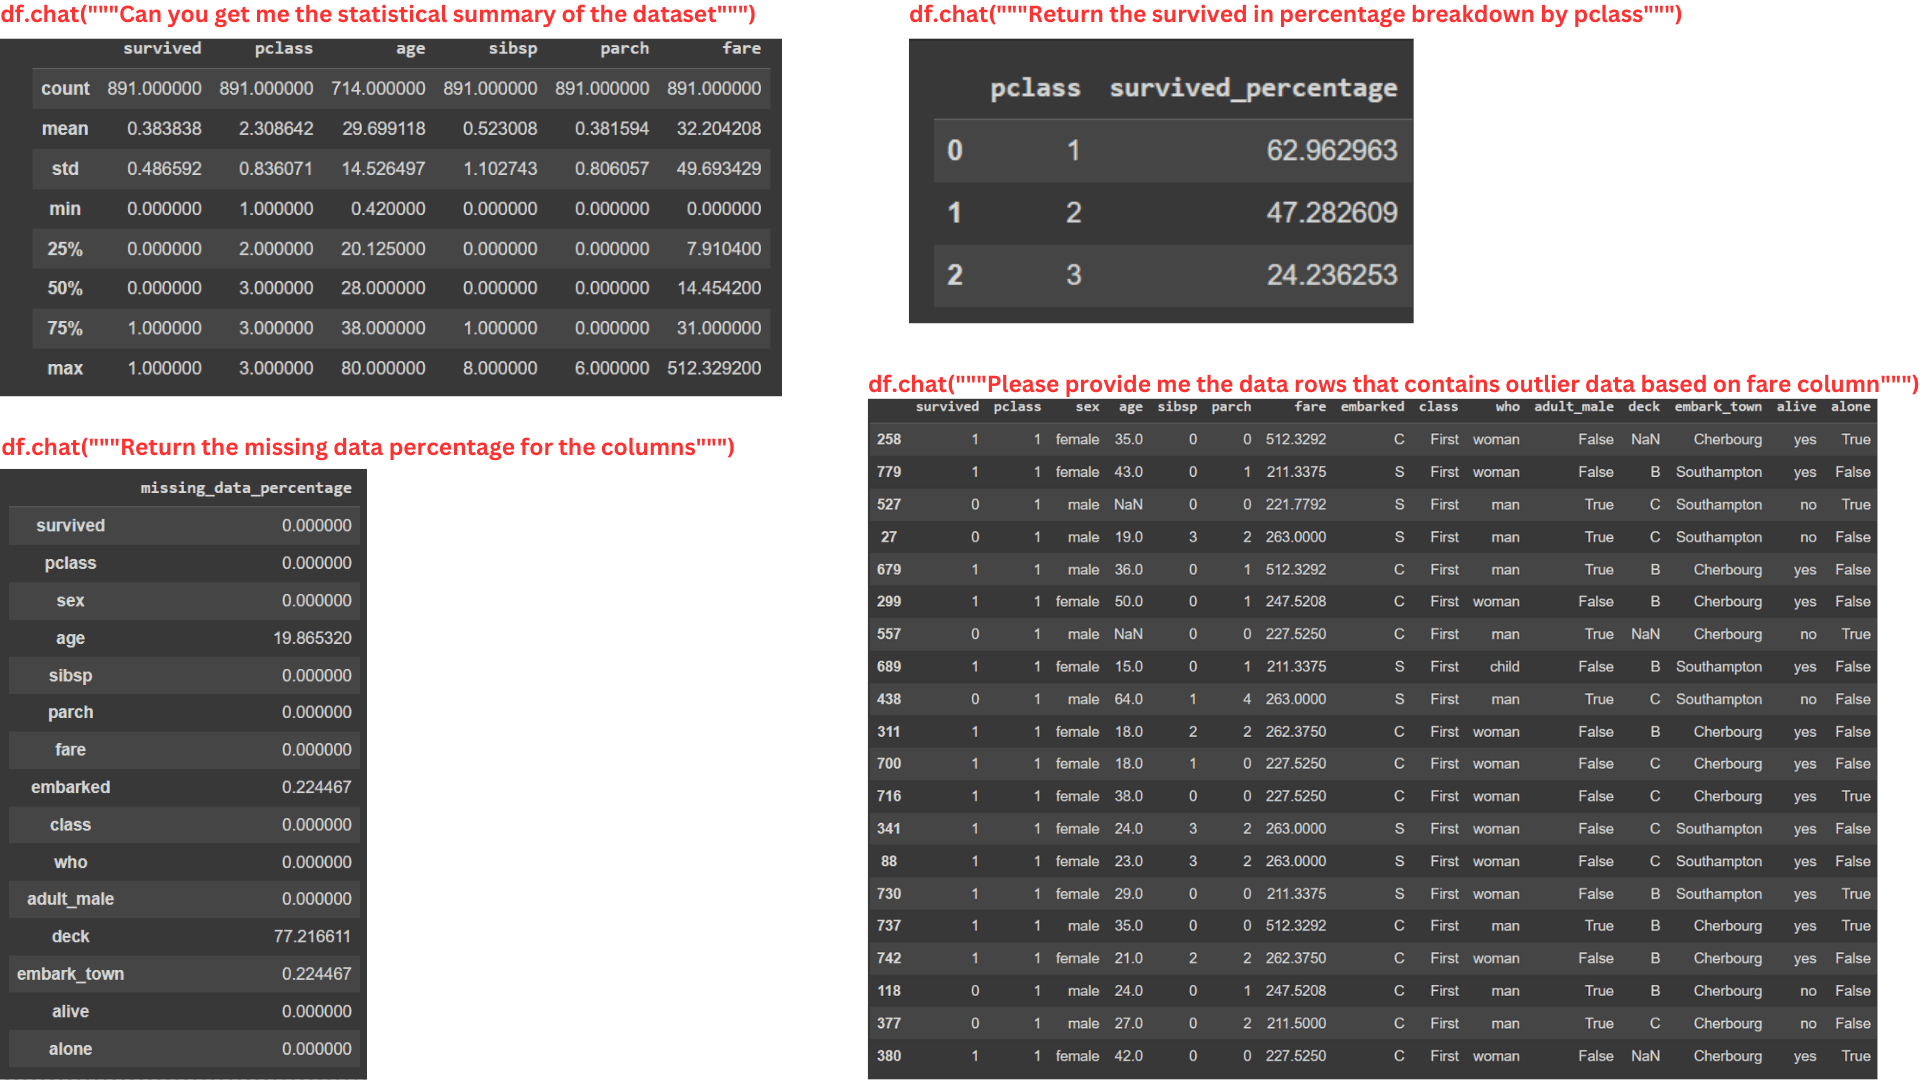
#Data Summarysummary = df.chat("""Can you get me the statistical summary of the dataset""")#Class percentagesurv_pclass_perc = df.chat("""Return the survived in percentage breakdown by pclass""")#Missing Datamissing_data_perc = df.chat("""Return the missing data percentage for the columns""")#Outlier Dataoutlier_fare_data = response = df.chat("""Please provide me the data rows that contain outlier data based on the fare column""")

Image source:https://www.kdnuggets.com/wp-content/uploads/wijaya_utilizing_pandas_ai_data_analysis_1.png
As shown in the image above, Pandas AI is capable of interpreting natural language prompts, even relatively complex ones, and returning meaningful results in the form of DataFrames.
That said, there are limitations. Extremely complex calculations may not be handled accurately, as the capabilities depend on the underlying LLM configured in the SmartDataFrame. However, with rapid advancements in LLMs, it's likely that Pandas AI will support more sophisticated analyses in the near future.
Data Visualization with Pandas AI
Not just data exploration, you can use Pandas AI for data visualization also. This generative AI can create beautiful and appealing visualizations for your data based on natural language prompts. However, you need to ensure your prompts are clear and understandable to get accurate outputs and understand your data better.
Here's a simple example.
response = df.chat('Please provide me the fare data distribution visualization')response
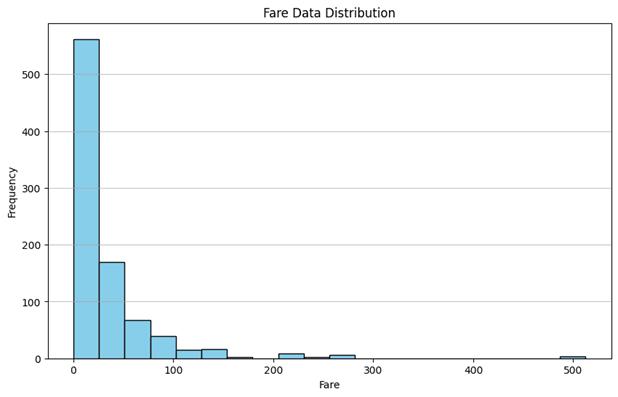
In this case, Pandas AI returns a bar chart showing the distribution of the Fare column. It's a quick way to generate visual insights without writing traditional plotting code.
Just like with data exploration, you can request various types of visualizations as well. While Pandas AI may not yet handle highly complex plotting tasks, it performs well for many common visualizations.
Here are a few more examples:
kde_plot = df.chat("""Please plot the kde distribution of age column and separate them with survived column""")box_plot = df.chat("""Return me the box plot visualization of the age column separated by sex""")heat_map = df.chat("""Give me heat map plot to visualize the numerical columns correlation""")count_plot = df.chat("""Visualize the categorical column sex and survived""")
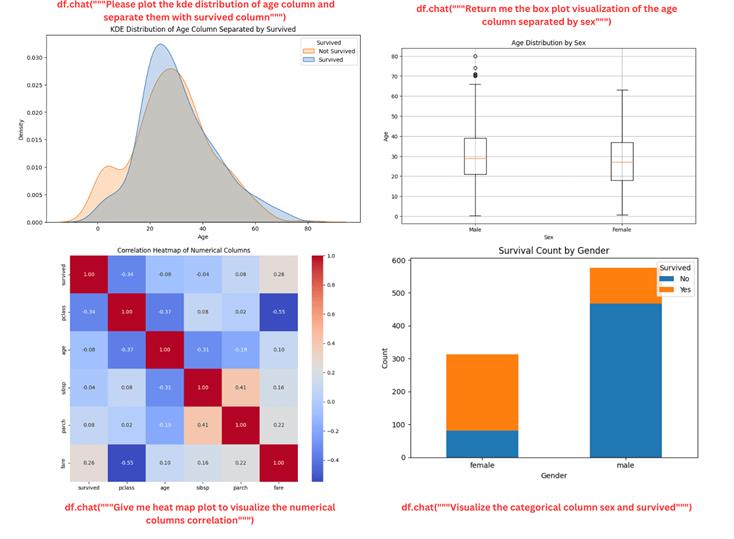
The result looks great. You can also continue asking follow-up questions to refine your visual analysis further.
Other Advanced Usage of Pandas AI
Pandas AI comes with several built-in APIs to help you streamline the experience. Here is some more usage of Pandas AI in your data science journey.
- Cache Management
Pandas AI stores prompts and results in your local directory by default to speed up the future requests by reusing previous outputs. Though this improves performance, it might sometimes lead to outdated or irrelevant responses because of cached results. Use the following to clear cache:
import pandasai as paipai.clear_cache()
To turn of cache at the beginning
df = SmartDataframe(data, {"enable_cache": False})
This ensures no prompt or result is stored during your session.
- Using a Custom Head
You can provide a sample head of your DataFrame to Pandas AI, which is useful when you want to:
- Avoid exposing full data to the LLM, or
- Offer a representative example instead of the full dataset.
Example:
from pandasai import SmartDataframeimport pandas as pd# head dfhead_df = data.sample(5)df = SmartDataframe(data, config={ "custom_head": head_df, 'llm': llm})
- Pandas AI Skills and Agents
Pandas AI supports the use of
- Skills i.e., custom functions you define and
- Agents, which can decide when to use these skills based on the prompt.
Let's say we want to visualize employee salaries. Here's how to do it:
import pandas as pdfrom pandasai import Agentfrom pandasai.skills import skillemployees_data = { "EmployeeID": [1, 2, 3, 4, 5], "Name": ["John", "Emma", "Liam", "Olivia", "William"], "Department": ["HR", "Sales", "IT", "Marketing", "Finance"],}salaries_data = { "EmployeeID": [1, 2, 3, 4, 5], "Salary": [5000, 6000, 4500, 7000, 5500],}employees_df = pd.DataFrame(employees_data)salaries_df = pd.DataFrame(salaries_data)# Function doc string to give more context to the model for use of this skill@skilldef plot_salaries(names: list[str], salaries: list[int]): """ Displays the bar chart having name on x-axis and salaries on y-axis Args: names (list[str]): Employees' names salaries (list[int]): Salaries """ # plot bars import matplotlib.pyplot as plt plt.bar(names, salaries) plt.xlabel("Employee Name") plt.ylabel("Salary") plt.title("Employee Salaries") plt.xticks(rotation=45) # Adding count above for each bar for i, salary in enumerate(salaries): plt.text(i, salary + 1000, str(salary), ha='center', va='bottom') plt.show()agent = Agent([employees_df, salaries_df], config = {'llm': llm})agent.add_skills(plot_salaries)response = agent.chat("Plot the employee salaries against names")
The agent intelligently determines whether to use the custom function based on your query. This combination of Skills and Agents offers a powerful way to customize and control how Pandas AI analyzes and visualizes your data.
Conclusion
By now, you must have understood how to use Pandas AI to power your data analysis, data visualization, and other data science workflows. You can enroll in top data science certifications and courses to learn more about it. LLMs are incredible tools, and using its power, data science professionals can significantly minimize their coding work in data analysis and focus on other strategic works.
So, you can start your data science journey with Python and learn the applications of Pandas AI and advance in your data science career smoothly and confidently.


